This page uses a neural machine assisted language translation

Spectrometer Comparison Chart by Application

(if you cannot see past the right side of the screen, scroll down to the bottom of the chart and use the left/right scroll bar, or else on some browsers, you can click on your middle mouse button [nav icon appears] and dragyour mouse right and left)
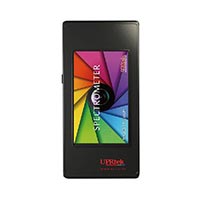
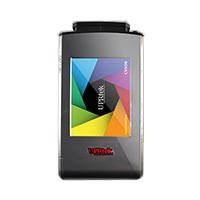
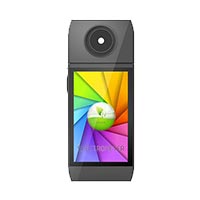
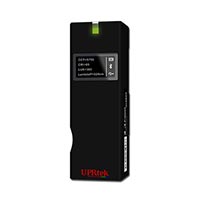
MK350S Premium product imageMK350N Premium product imageCV600 Product ImagePG200 Product ImageMK350D product image
ApplicationKey FeaturesMK350S PremiumMK350N PremiumCV600PG200NMK350D
Lighting CommerceLux CIE Chromaticity Diagram
CRI

Spectrum
Flicker Measurement
Light ManufacturerLux CIE Chromaticity Diagram
CRI
Spectrum
Compare Mode

LED BIN Rating Mode
Logging Mode
Checker Mode
Visual MerchandisingLux CIE Chromaticity Diagram
CRI
Spectrum

TM-30
LUX.G Image Distribution
Interior Lighting DesignLux CIE Chromaticity Diagram
CRI
Spectrum

TM-30
LUX.G Image Distribution
Transmit Mode
Blue Light Hazard Risk Mode
Plant Factory & Grow LightsLUX.G Image Distribution------
SpectrumOEM/ODM
PPFD/PFD
Logging Mode

---
Compare Mode---
PPFD Spectrum------
Grid Mode------
TV, Cinema & Stage Lighting
Spectrum
TM-30
Flicker Measurement

Filter Measurement
Exposure Mode
Lighting and Visual HealthTransmit Mode
HCL Mode
Blue Light Hazard Risk Mode

Spectrum
Flicker Measurement