What Is Hue, Saturation, Brightness and Spectrometers?

by | Apr 30, 2024 | Blogs, Lighting Metrics | 2 comments

Hue, Saturation and Brightness Introduction


Color is a fundamental concept we use to differentiate objects, like red apples from green ones. While we can generally agree on basic color distinctions, finer shades can be subjective.

Hue, Saturation, and Brightness offer more precise ways to understand and utilize color in various fields such as Design, Business, Manufacturing, and Science. Spectral devices provide metrics to measure these characteristics accurately.

Fuel Pumps

Fig 1 Photo by Agung Raharja on Unsplash

What Is Hue? The Classification of Color (Dominant Wavelength λd)

Hue Definition

Hue is essentially synonymous with “Color” but refers to a defined classification system as the Color Wheel (Figure 2). Designers and artists use the Color Wheel in Color Theory to mix, match, and contrast hues.


Colorwheel

Fig 2 RGB Color Wheel

Hue and The Classification of Color (Dominant Wavelength λd)

In light color, hues are similarly perceived on the CIE 1931 Chromaticity Diagram, categorized by Wavelengths around the outer edge (380nm – 780nm).

If you have an LED lamp whose color coordinates (x,y) are represented on the CIE Chroma Diagram (Fig 3), you can draw a line from the white center point through the x-y spot to the outer edge. This will reveal its hue, also referred to as the Dominant Wavelength (λd) of that light. In our example, it is yellowish-orange, or more formally 578 nm.

Fig 4 Spectrometer x-y, and Dominant Wavelength λd

Fig 3 CIE 1931 Chroma Diagram

What Is Saturation? The Vividness of Colors (Purity).

Saturation Definition

Saturation refers to the purity or intensity of a color. A highly saturated color appears vivid, vibrant, and rich, while a desaturated color looks pale, dull, or washed out. In color science, saturation helps differentiate between a strong, pure red and a faded pink, even though both share a similar hue.

Understanding what saturation is allows designers, scientists, and manufacturers to better describe and control how colors are perceived in real-world applications.

Saturation and the Vividness of Colors (Purity)

On the CIE 1931 diagram, colors near the boundary’s edge are more vivid or saturated, while those closer to the center appear duller, less saturated.

The metric “Purity” (0-100%) describes how close a color is to its outer edge, indicating its saturation level.

Fig 5 Spectrometer Purity Measurement

Fig 6 x-y points closer to the edge are more saturated, else they are more desaturated.

Hue vs Saturation: What’s the Difference?

While hue and saturation are often mentioned together, they describe different aspects of color. Hue refers to the basic classification of color — such as red, blue, green, or yellow — and is linked to the dominant wavelength of light. It tells us what color we are seeing.

Saturation, on the other hand, measures the vividness or purity of that color. A highly saturated hue looks bold and vibrant, while a low-saturation hue appears pale or washed out. For example, both bright red and pink share the same hue family, but pink is less saturated because white light has been added, reducing its purity.

Understanding the difference between hue and saturation is crucial in fields like design, printing, and manufacturing, where precise color reproduction matters. A spectrometer can measure both hue (dominant wavelength) and saturation (color purity), providing objective data that eliminates subjective interpretation.


What Is Brightness? The Quantity of Light (LUX).

Brightness Definition

Brightness stands apart from hue and saturation, referring to the intensity of light or quantity of light. Hue and saturation, however, pertain to the color of light.

Another way to think about it is if you crank up the brightness of a light, it will hurt your eyes, but if you crank up the saturation of a color, it will not.

Brightness and LUX

In lighting science, brightness is often quantified using the metric LUX, which is defined as lumens per square meter. It measures the quantity of light reaching a surface area, giving us an objective way to compare how “bright” different environments feel.

For example, a typical office workspace may be designed at 300–500 lux, while a sunny outdoor environment can easily exceed 10,000 lux. These values help architects, engineers, and designers ensure that spaces meet visual comfort and safety standards.

Spectrometers and light meters are commonly used to capture lux values accurately. By doing so, professionals can go beyond subjective impressions of brightness and instead rely on precise, repeatable measurements that support quality control and compliance with international lighting standards.

Fuel Pumps

Fig 7 Spectrometer LUX measurement

Saturation vs Brightness: Key Differences Explained

​Although saturation and brightness are often mentioned together, they represent very different characteristics of color. Saturation describes the purity or vividness of a hue. A highly saturated color looks intense and vibrant, while low saturation makes the same hue look pale, faded, or washed out.

Brightness, on the other hand, refers to the perceived amount of light coming from or reflecting off a surface, and it is commonly measured in lux. A color can remain the same hue and saturation but appear brighter or darker depending on the intensity of light illuminating it. For example, a fully saturated red apple will look vivid whether it is under dim light or bright sunlight, but its brightness will change dramatically between the two environments.

Understanding the difference between saturation and brightness is critical in industries like display manufacturing, photography, and interior lighting design. Spectrometers and color measurement tools help professionals separate these attributes, ensuring that colors remain consistent and accurate across various devices, materials, and environments.


How Hue, Saturation, and Brightness Work Together in Color Perception

​While hue, saturation, and brightness can be defined separately, in practice they work together to shape how we perceive color. Hue gives us the basic classification of a color — red, green, or blue. Saturation determines the vividness or purity of that hue, making it look either vibrant or muted. Brightness controls the overall intensity of the light, allowing the same color to appear either light or dark.

To illustrate, imagine a blue sky. Its hue is clearly blue, but its saturation can vary from a deep, rich navy at sunset to a pale, washed-out tone on a hazy day. Meanwhile, its brightness changes dramatically depending on whether you look at the sky at noon under direct sunlight or at twilight when illumination is fading.

In real-world applications — from digital displays to printed packaging and architectural lighting — professionals must account for the interaction of hue, saturation, and brightness to achieve consistent color experiences. Spectrometers and other measurement tools provide the objective data needed to analyze these three attributes, ensuring that what we see is accurate and repeatable across environments.


Hue  (λd), saturation  (Purity), brightness  (LUX): What does it all mean?

So, how do companies, businesses, and organizations utilize these aspects of light to ensure consistency in lighting applications? They use a spectrometer to measure Dominant Wavelength, Purity, and LUX to ensure lighting consistency.

Purchasing Lights: Compare and Contrast

When a consumer buys a light to replace an existing light, they’ll probably use CCT (Correlated Color Temperature) to ensure it matches other bulbs in the house. Buying a bulb with a 3000K CCT can land a λd in any of many places (Fig 8). However, they probably won’t notice any visual differences – it’s good enough.

But it does matter in public facilities like museums.  Why? Because lights are typically aligned in rows, even subtle differences in the lights are noticeable.   Also, buying in bulk is risky because purchasing tens or hundreds of lights that are not uniform or match existing lights could be a nightmare.

That said, spectrometers with light comparison features (Fig 9) are must-haves.   If you are considering two lighting brands and want to determine which one is more uniform and better at matching existing lights in the facilities, CCT is unacceptable.  You must use a finer gradient of measures like dominant wavelength, Purity, or LUX.

Also note that buyers and sellers use other metrics, like Δx and Δy to help determine the qualities of light bulbs.


Fuel Pumps

Fig 8 λd can vary for 3000K lights

Troubleshooting problems:

Light and color for LED manufacturing is not an exact science.  LED engineers go to great lengths to ensure consistency and pinpoint accuracy in their light’s hue, saturation, and brightness.  They will also use Dominant Wavelength, Purity, LUX, and other metrics to ensure quality or troubleshoot anomalies that customers may encounter.

Dominant Wavelength is used in LED chip classification in a process called “binning”.  When LED chips are turned out, you can’t predict exactly what hue they will exhibit.  So, they can only be classified after they are produced by measuring their Dominant Wavelength and placing them in the appropriate “bins”.

Spectrometer Comparison Feature

Fig 9 Spectrometer Comparison Feature

Get your FREE copy of UPRtek Lighting Guide!

Packed with essentials on lighting history, science, manufacturing, safety, and spectrometers – perfect for beginners and lighting pros alike. Just enter your email to download instantly.

UPRtek Survival Handbook

Conclusion:

While “Color” is a convenient term for everyday distinctions, industries like design, manufacturing, business, and research require more nuanced understandings.

When buying and selling products in bulk, a lot is at stake when trying to purchase the best lights for a facility or organization – and these organizations use spectrometers to measure Dominant Wavelength, Purity, and LUX to ensure their lights are uniform and meticulously consistent.

It’s also a high-stakes game for LED manufacturers, who compete for business and thus scrutinize details to ensure top-quality products that meet customer demands.

Tools like the Spectrometer level the playing field, making sure Hue, Saturation, and LUX are accurate, allowing manufacturers and organizations to buy and sell with integrity and confidence.

Read On: MK350S Premium All-Purpose


MK350S Premium

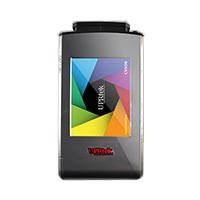
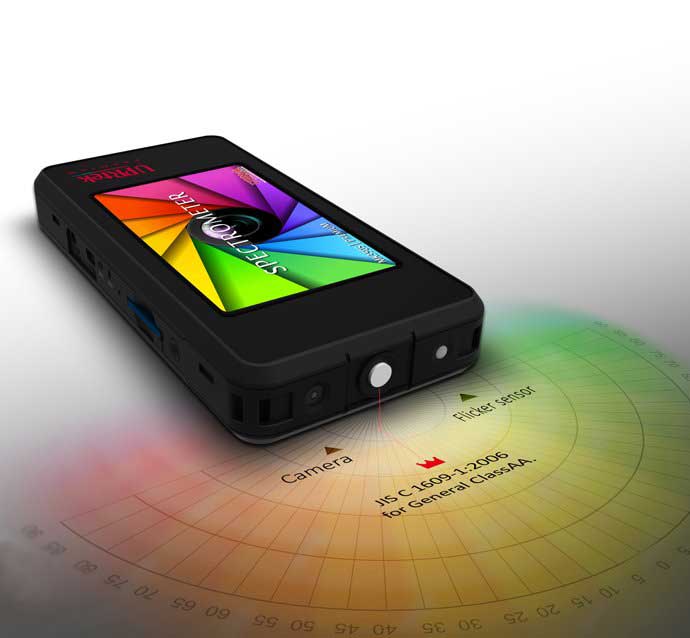
Fig 10 UPRtek MK350S Premium

Hot Product

MK350S Premium product image

MK350S Premium

MK350S Premium is a full-featured Handheld Spectrometer used by lighting professionals with wide ranging projects and lighting challenges.

MK350N Premium product image

MK350N Premium

The MK350N Premium is our popular mid-range spectrometer, made for professionals who want top spectrometer performance without the need for specialized niche features (e.g. Manufacturing , PAR meter, Lighting Design).

MK350D product image

MK350D Compact

The MK350D Compact spectrometer is for users who just need a simple product with basic measurements essentials. And yet, the measurement needs to be precise and up to the scrutiny of global standards.

PG200 Spectral PAR Meter Product Image

PG200N Spectral PAR METER

The PG200N is a Spectral PAR meter used to measure the quantity and quality of light for a new generation of indoor farmers who use artificial lighting as a substitute or complement to sunlight.

CV600 Product Image

CV600 Cinema Spectral Meter

The CV600 spectral color meter is for cinema and stage lighting professionals, providing tools to help assess/adjust color fidelity, improve color rendering, purchase better lights, recall lighting setup from previous performances and make better overall choices about lighting with the numbers.

UV100n front view

UV100N Spectral UV Meter

The UV100N Spectral UV Meter measures ultraviolet light for modern day UV light applications requiring versatility and spectral visualization.

MK330T product image

MK550T Handheld Spectroradiometer

The MK550T Handheld Spectroradiometer is used by Display Panel manufacturers as a cost-effective, lab-level device that measures panel performance.

MD100N product image

MD100N Desktop Spectroradiometer

The MD100N is a spectroradiometer that is cost-effective, with fast measurement times, and a focus on Laboratory-level precision. It can be used by manufacturers, OEM/ODM companies of any size and allows much more flexibility and versatility in Quality Control.

uSpectrum PC Software product image

uSpectrum PC Software

With the uSpectrum PC Software, you can connect your UPRtek device by USB cable to a PC or laptop, for full screen views and keyboard operations.

uFlicker PC Software product image

uFlicker PC Software

The uFlicker PC Software allows you to cable-connect your PC to a UPRtek device for PC controlled flicker operations. This allows you to have a workstation with operative controls, and full screen view with flicker data and graphs all in one place.

2 Comments

  1. Jarda

    Thank you for the educational articles, they are great!

    Reply
    • UPRtek

      Thank you Jarda, come get our Free handbooks if you haven’t already – Lighting, Flicker, Cinema Lighting, Grow Lights. You can find them in our Support>Download Center.

      Reply

Submit a Comment

Your email address will not be published. Required fields are marked *

Handbook Series

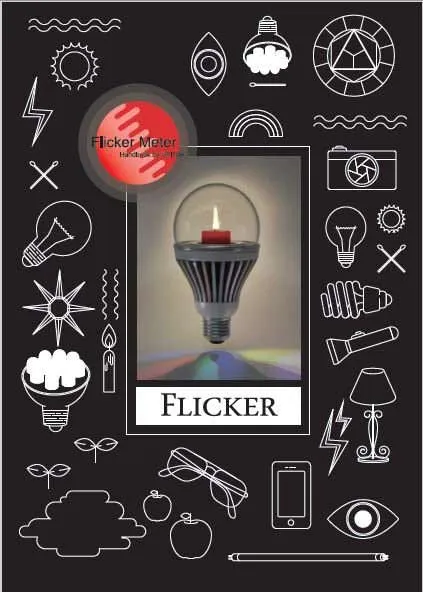
The Flicker Handbook

Everything thing you need to know about Flicker, an insidious, potentially serious lighting artifact impacting visual safety for public places like hospitals, offices, libraries, and more...

▸ Get it!

About UPRtek

United Power Research and Technology

UPRtek (est. 2010) is a manufacturer of portable, high-precision light measurement instruments; Handheld Spectrometers, PAR meters, Spectroradiometers, Light Calibration Solutions.

UPRtek HQ, R&D and manufacturing are all based out of Taiwan, with Worldwide representation through our certified Global Resellers.

▸ Read on

UPRtek at B&H

Category