What is TM-30-15 (TM-30-18), Should I use it? How it Work?
, Should I use it? How it Work?")
TM-30-15 Introduction
TM-30-15 is a color rendering index system published by IES (Illuminating Engineering Society). A color rendering index system indicates how well a light, when shining on objects, can reproduce the object’s color accurately (compared to a black body radiator – e.g., the sun). TM-30-15 is next in a line of predecessor CRI systems (CIE CRI, GAI, CQS), each intended to improve on previous designs. In this article, we explain TM-30-15, its advantages, and why it’s important.
- CIE CRI Review
- TM-30-15 is better because it uses 99 reference colors
- TM-30-15 is better because it uses the CAM02-UCS Color Space
- How TM-30-15 works?
- Why should you use the TM-30-15 and TM-30-18?
(Click link for an introduction to Color Rendering Index)
Photo by Andrew Leu on Unsplash
CIE CRI Review
Let’s first review CIE CRI because it is the prevalent standard and will give us context to compare with TM-30-15. The original CIE CRI used 8 sample reference colors (R1-R8) to determine how a light source renders those colors compared to sunlight (or another black body radiator). Later other colors R9 – R15 were added.
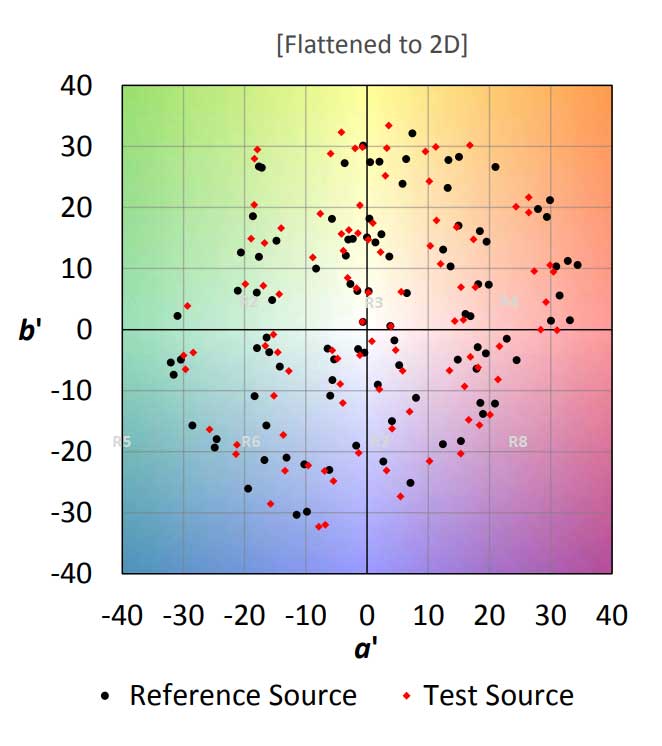
These comparisons are made using a color diagram (or color map), notably the CIE 1960 chromaticity diagram.

You can visualize this in the next diagram. The black dots represent how the eight reference colors (R1-R8) are rendered by sunlight, and the red dots are the eight colors rendered from a test light source. The distances between the black and red dots are based on a 100-point scale and averaged for a final CRI score. The closer to 100, the closer the test light is to sunlight.

CIE 1960 Chromaticity Diagram
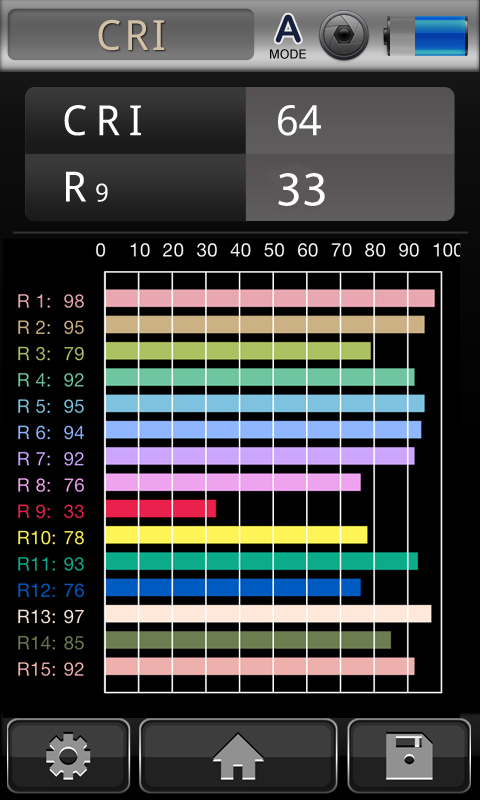
CRI R1-R8 (additional R9-R15 were added later)
TM-30-15 is better because it uses 99 reference colors
The original 8 CIE CRI colors were pastels used for garment and architectural applications. Comparatively, TM-30-15 uses 99 reference colors, a more extensive base of samples representing more practical, real-world colors.
These colors were selected from an extensive database of real-world objects.
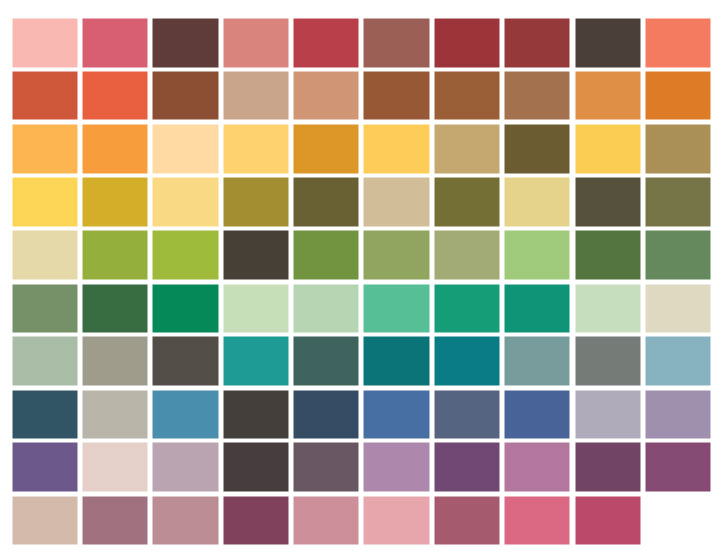
TM-30-15 color samples (99)
https://www.energy.gov/sites/default/files/2015/09/f26/tm30-technical-webinar_9-22-15.pdf
TM-30-15 is better because it uses the CAM02-UCS Color Space
An essential aspect of TM-30-15 is the CAM02-UCS color space, the latest Color Space endorsed by the CIE organization. Color Spaces are used for identifying color in a “3d space map” of colors. CAM02-UCS is next up in a line of color spaces intended to improve on their predecessors (CIE 1931, CIE 1960, CIE 1976, CIELUV, CIELAB). But how does CAM02-UCS make it more accurate?
As noted before, most CIE CRI comparative analysis is done on the CIE 1960 color map, a flat 2d representation, where only the rendered color (fidelity) is juxtaposed with sunlight.
CIE 1960 Color Chromaticity Diagram
However, more recent CRI systems recognize that color perception and identification are more complex, involving other dimensions, notably lightness and chroma (saturation), as Albert H. Munsell’s 3D diagram suggests.
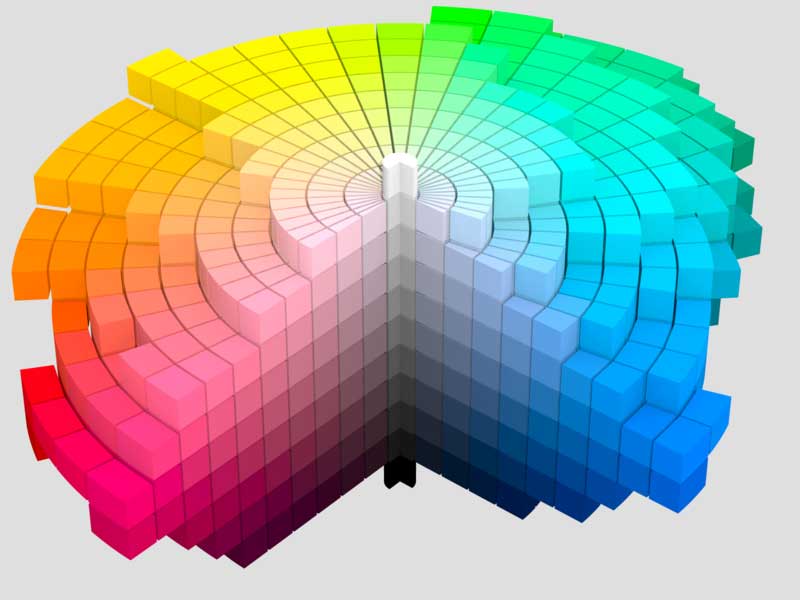
Munsell 1943 color solid cylindrical coordinates: SharkD - Derivative work: Datumizer
Also using this new perception in color, the CAM02-UCS will appear in a 3d color space. The three dimensions are similar to the three dimensions of the Munsell Diagram (hue, lightness, saturation). A better way to identify a color based on human perception means more accurate color rendering information.
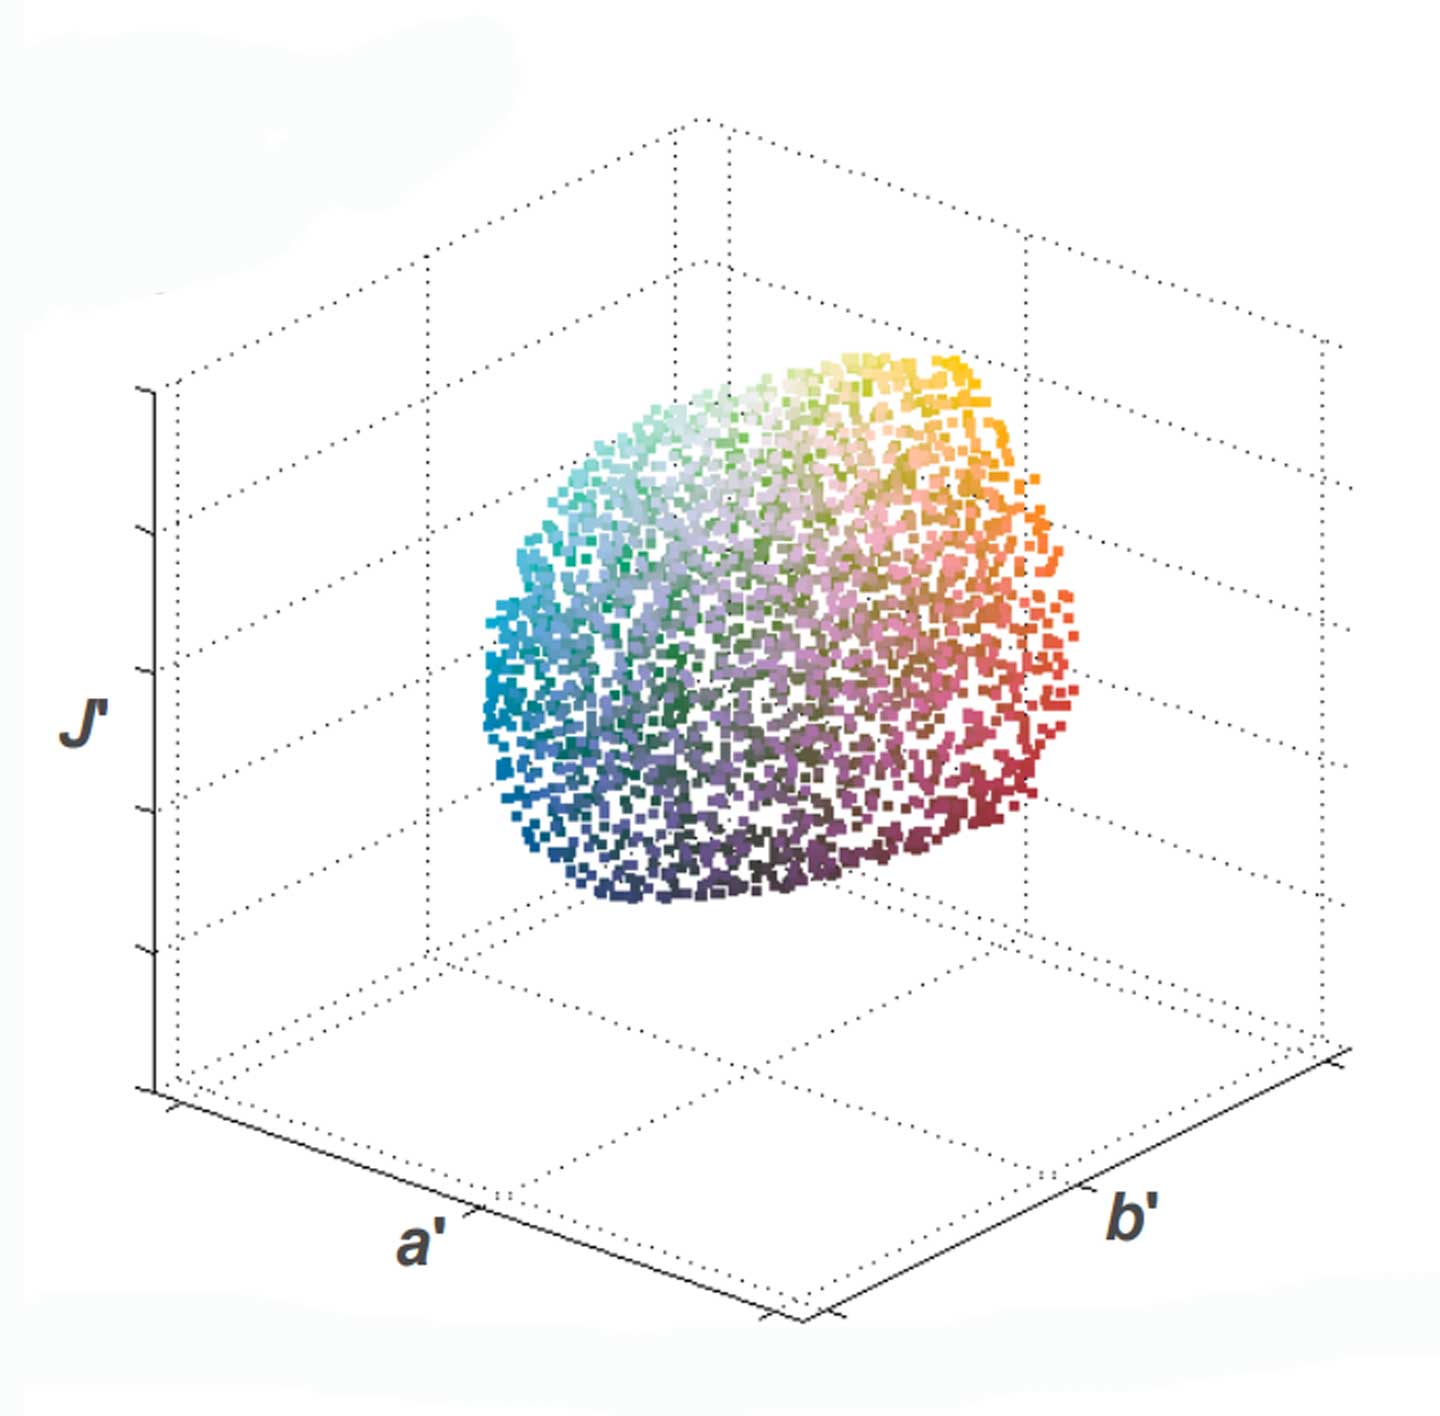
CAM02-USC Color Space: https://www.energy.gov/sites/default/files/2015/09/f26/tm30-technical-webinar_9-22-15.pdf
Additionally, CAM02-USC also alleviates distortions that affect color uniformity. An example of distortions can be seen with the CIE 1931 color map (shown as MacAdam’s ellipses). They found that colors within any points of an ellipse are indistinguishable, distorting the color space’s area. The more elongated the ellipse, the more distorted the shape of the diagram.
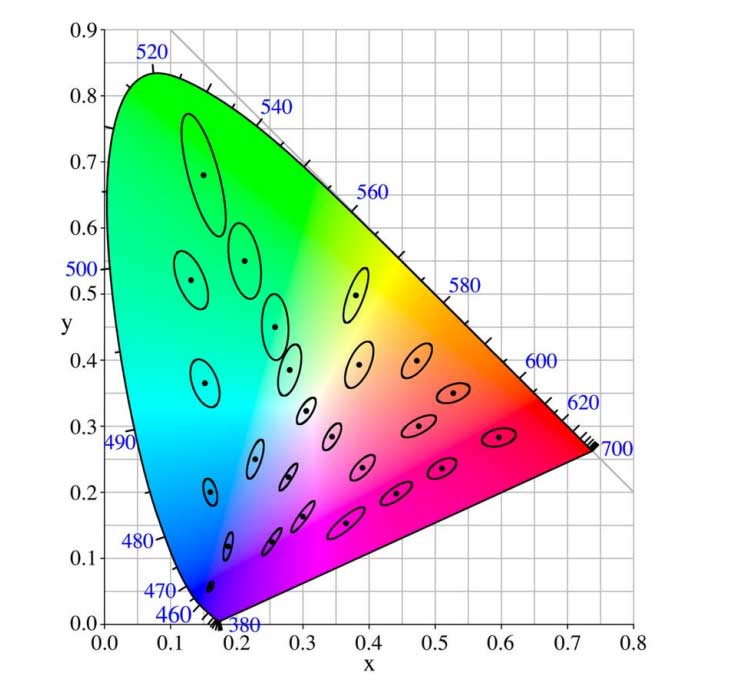
https://www.energy.gov/sites/default/files/2015/09/f26/tm30-technical-webinar_9-22-15.pdf

The CAM02-USC alleviates distortions, even compared to CIELAB (more circular ellipses, less distortion).
How TM-30-15 works?
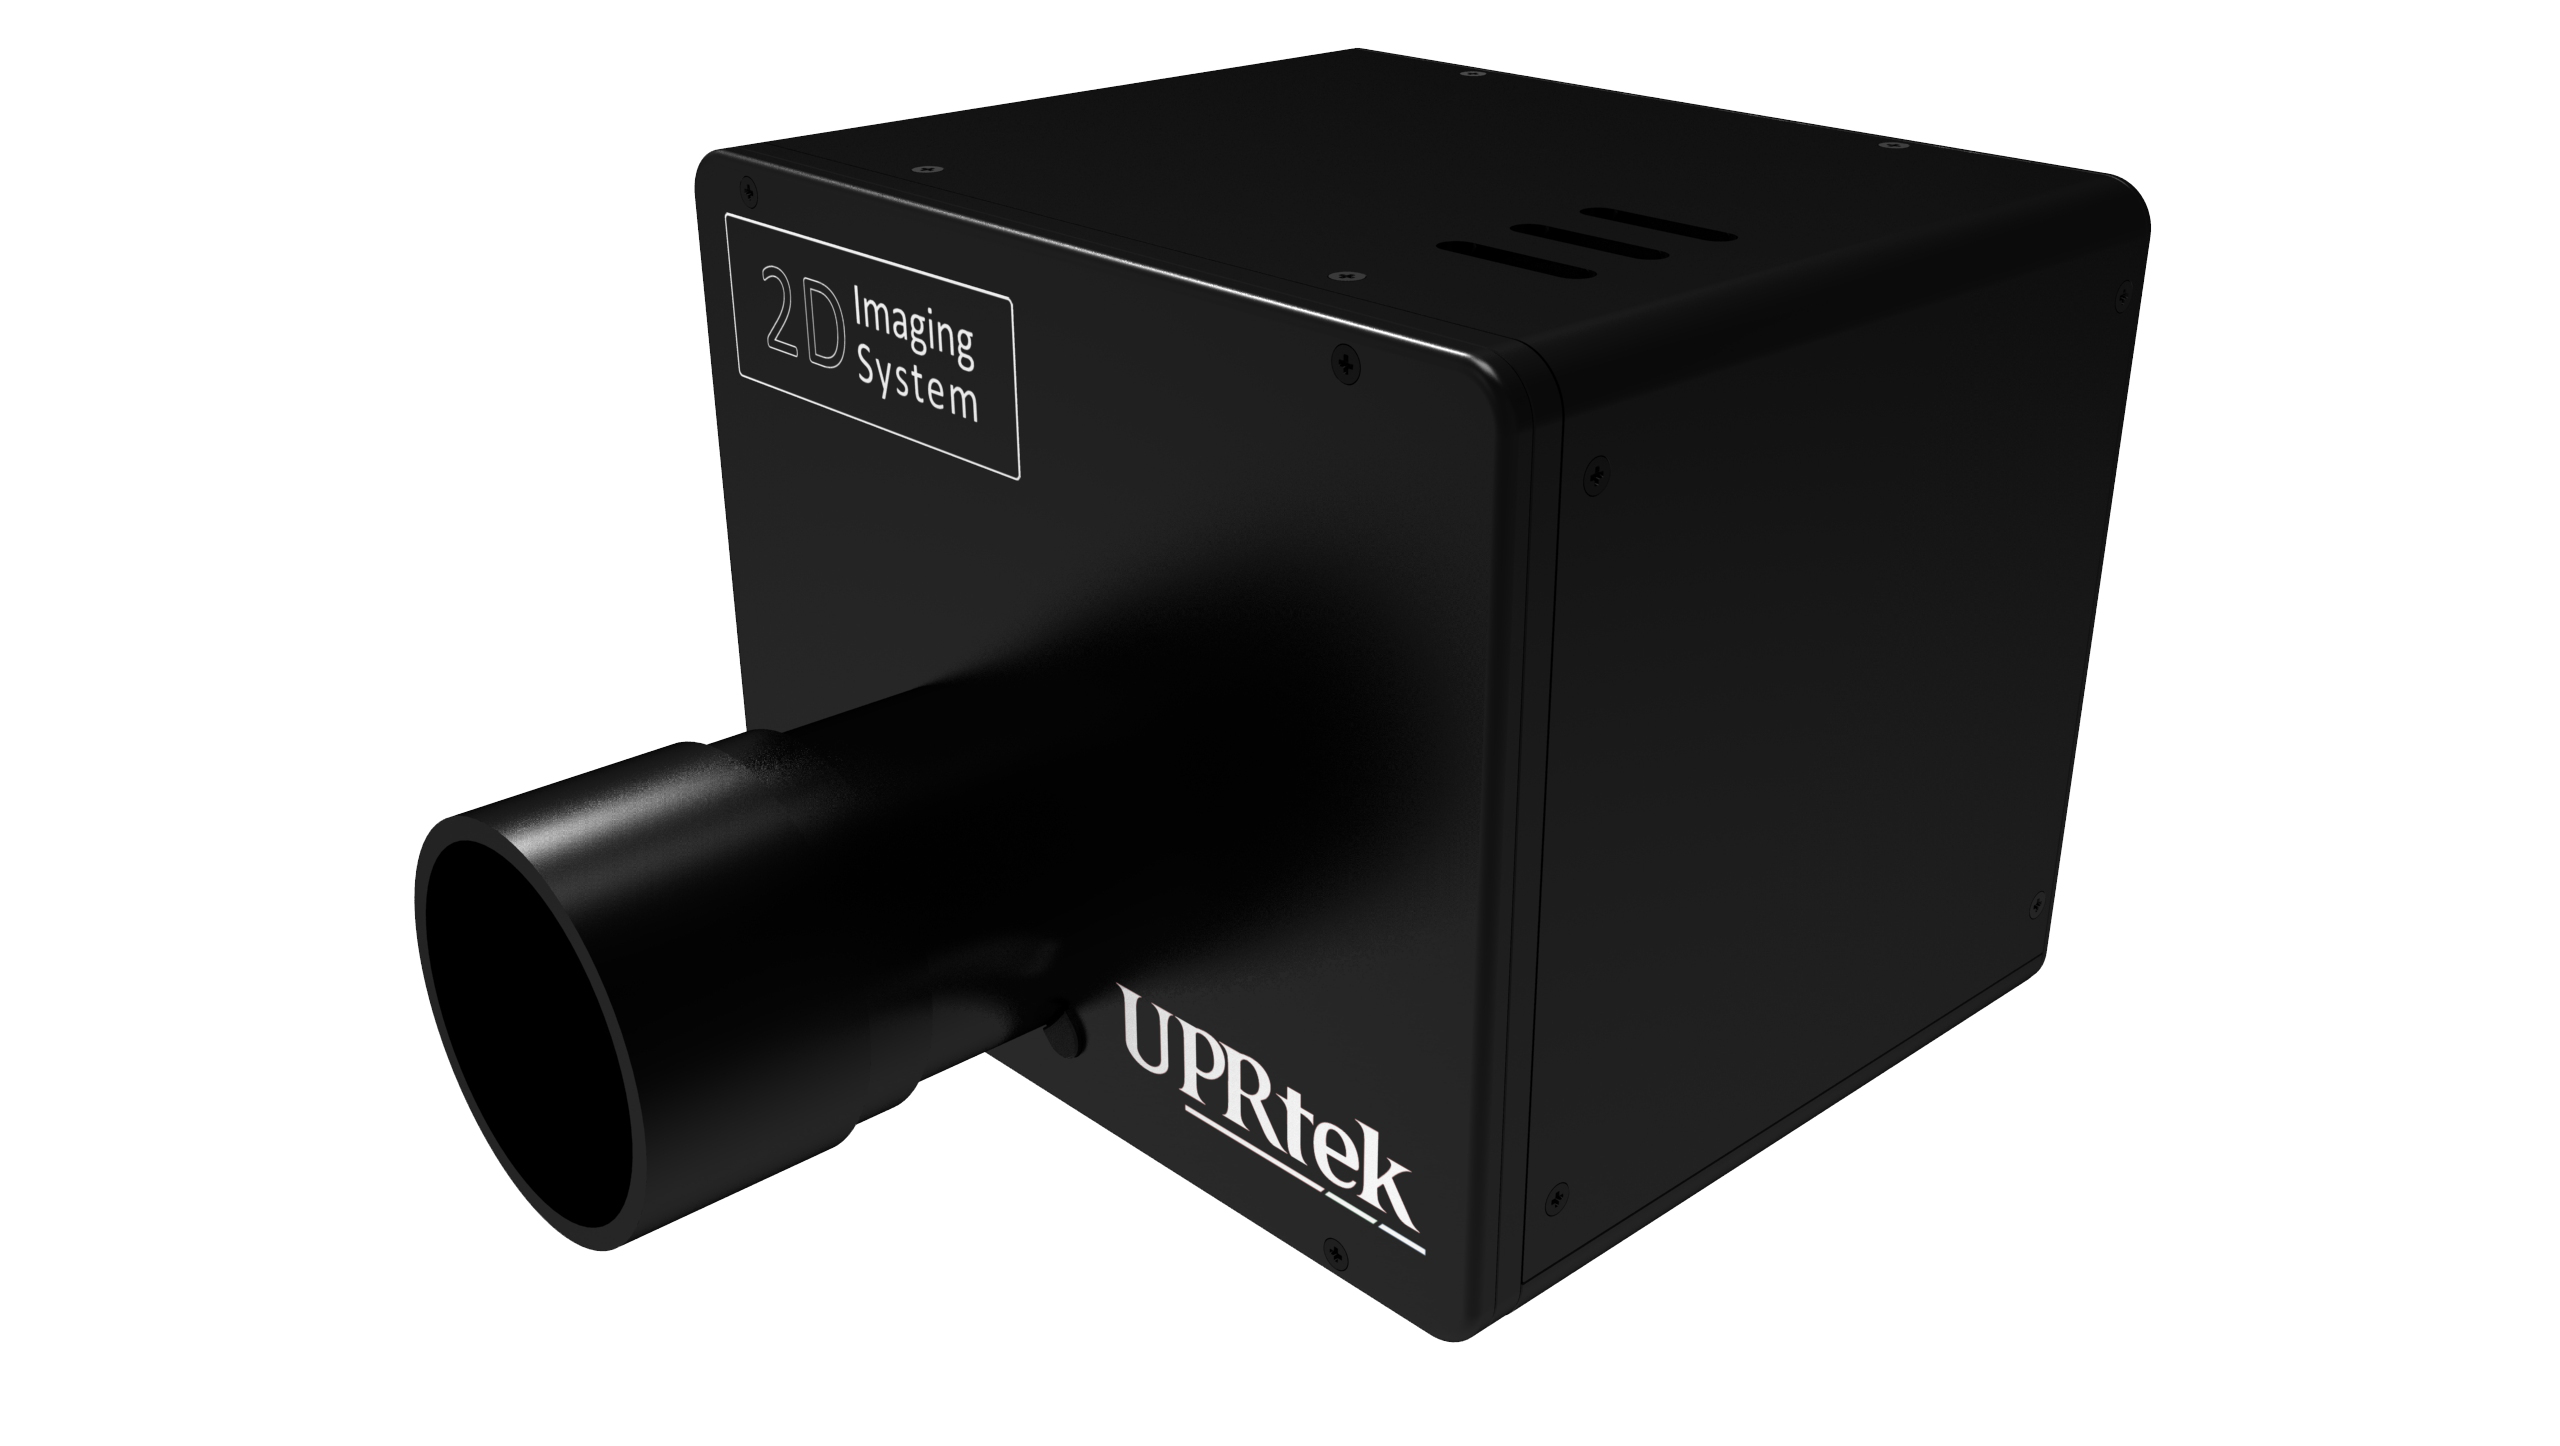
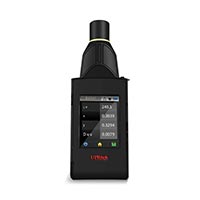
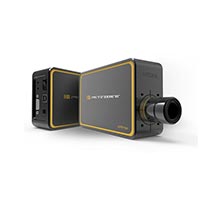
To measure the Color Rendering capabilities of light, you will need a light source spectrometer, like the UPRtek MK350S Premium, or other devices that measure with the TM-30-15 protocols.
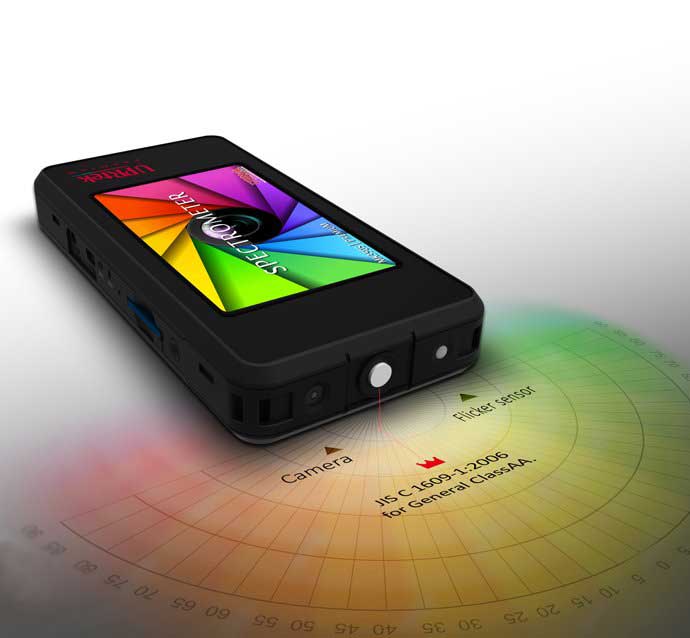
UPRtek Spectrometers can measure color rendering using any number of protocols; CIE CRI, CQS and TM-30-15
Capture light from the test light, and the device will take it from there. Note that the SPD and spectral reflectance data for 99 samples and sunlight are already stored within the device. The device will use algorithms to determine rendering disparities between the test light and sunlight mathematically and reveal two metrics and two graphs.
Rf metric
The Rf metric is similar to the CIE CRI “CRI” value, an average of the test-light-to-sunlight color fidelity disparities for the 99 test samples. The differences are judged on a 100-point score, with the higher numbers indicating the ability of the test light to generate colors closer to sunlight.
Rg metric
The Rg metric represents the other important factor for human perception of color; saturation. It is also an average of the disparities between test light and sunlight. It is based on a baseline score (100) – higher scores (100-140) indicate higher saturation (on average), and otherwise lower scores (60-100) indicate undersaturation.
Color Vector Graph
The Rg metric is a number that reflects overall under or over-saturation but doesn’t indicate which color areas are problematic. The TM-30-15 remedies this with a superimposed circular vector graph over a color space, representing where color saturation anomalies occur. Note that the CAM02-USC color space is a 3D space, but it has been “flattened” to show the shifts in the saturation dimension.

Three instances of Color Vector Graphics showing where the color saturation anomalies occur.
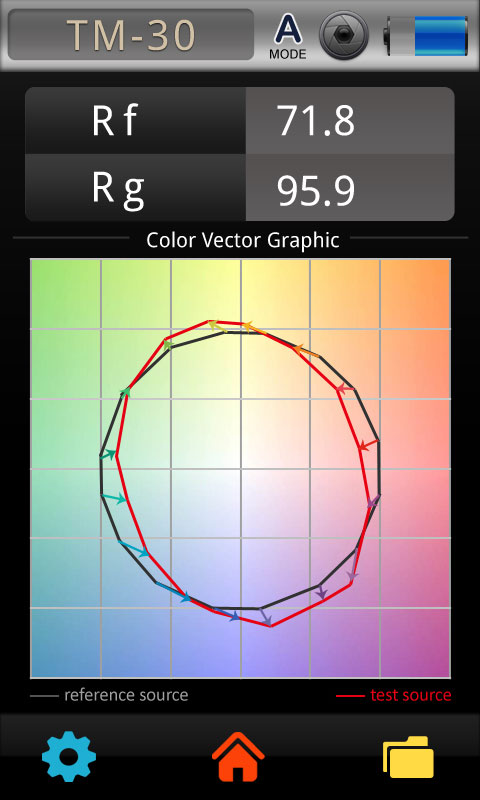
MK350S Premium TM-30 metrics and Color Vector Diagram. The diagram shows oversaturation (yellow-green & magenta) and undersaturation (orange & green blue)
Rf-Rg Plot Graph
This graph simply plots Rf against Rg giving an overall visual representation of the render quality of a light. This is very handy visual tool when comparing lights.
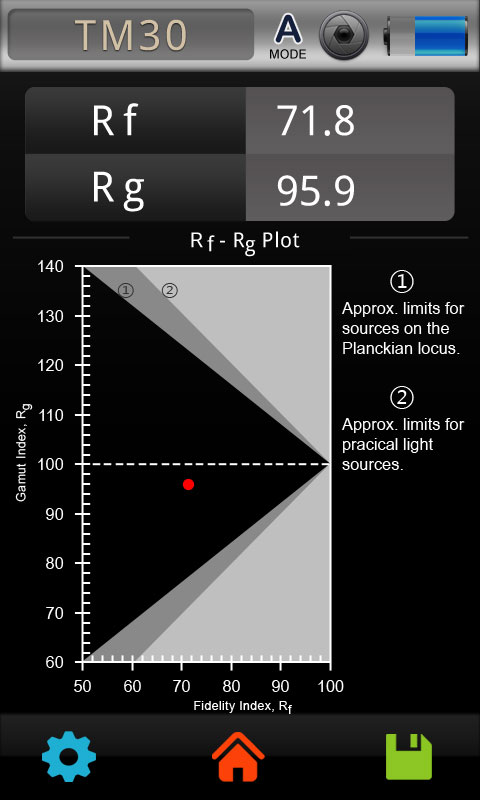
This Rf-Rg graph show the overall render quality of a light (red dot). If dots approach the convergence point (right side), it demonstrates a better quality of light.
Why should you use the TM-30-15 and TM-30-18?
The TM-30-15 system is a sophisticated and relatively recent (2015) Color Rendering Index system. It uses the CIE-endorsed CAM02-USC color space and 99 color samples to boost the gradation of measurement and accuracy of results.
Even though CIE CRI is still the established Color Rendering standard, its deficiencies have been well documented, and its position has been challenged in recent years by new protocols.
TM-30-15 has made a significant push for validation in the market. There has already been considerable conversation and discussion on the web about TM-30-15, and its advantages are indisputable. In 2018, IES upgraded TM-30-15 to TM-30-18 to use CIE’s more recent Color Fidelity changes (CIE 224:2017), a significant move towards acceptance in the global community.
But you needn’t wait. The UPRtek models have been recently updated from TM-30-15 to TM-30-18. If you have one already, you can quickly upgrade to the latest TM-30-18 updates and test it without any setup or configuration. Compare it to CIE CRI measurements, and you can experience the advantages of TM-30-18.

UPRtek TM-30-18 specifications
References:
US Department of Energy (Office of Energy Efficiency & Renewable Energy), IES (Illuminating Engineering Society), September 28, 2015, https://www.energy.gov/eere/ssl/downloads/webinar-technical-discussion-tm-30-15
US Department of Energy (Office of Energy Efficiency & Renewable Energy), IES (Illuminating Engineering Society), September 15, 2015, https://www.energy.gov/sites/default/files/2015/09/f26/tm30-intro-webinar_9-15-15.pdf
Hot Product
Handbook Series
The Flicker Handbook
Everything thing you need to know about Flicker, an insidious, potentially serious lighting artifact impacting visual safety for public places like hospitals, offices, libraries, and more...
About UPRtek
United Power Research and Technology
UPRtek (est. 2010) is a manufacturer of portable, high-precision light measurement instruments; Handheld Spectrometers, PAR meters, Spectroradiometers, Light Calibration Solutions.
UPRtek HQ, R&D and manufacturing are all based out of Taiwan, with Worldwide representation through our certified Global Resellers.
Latest Articles
Category
0 Comments